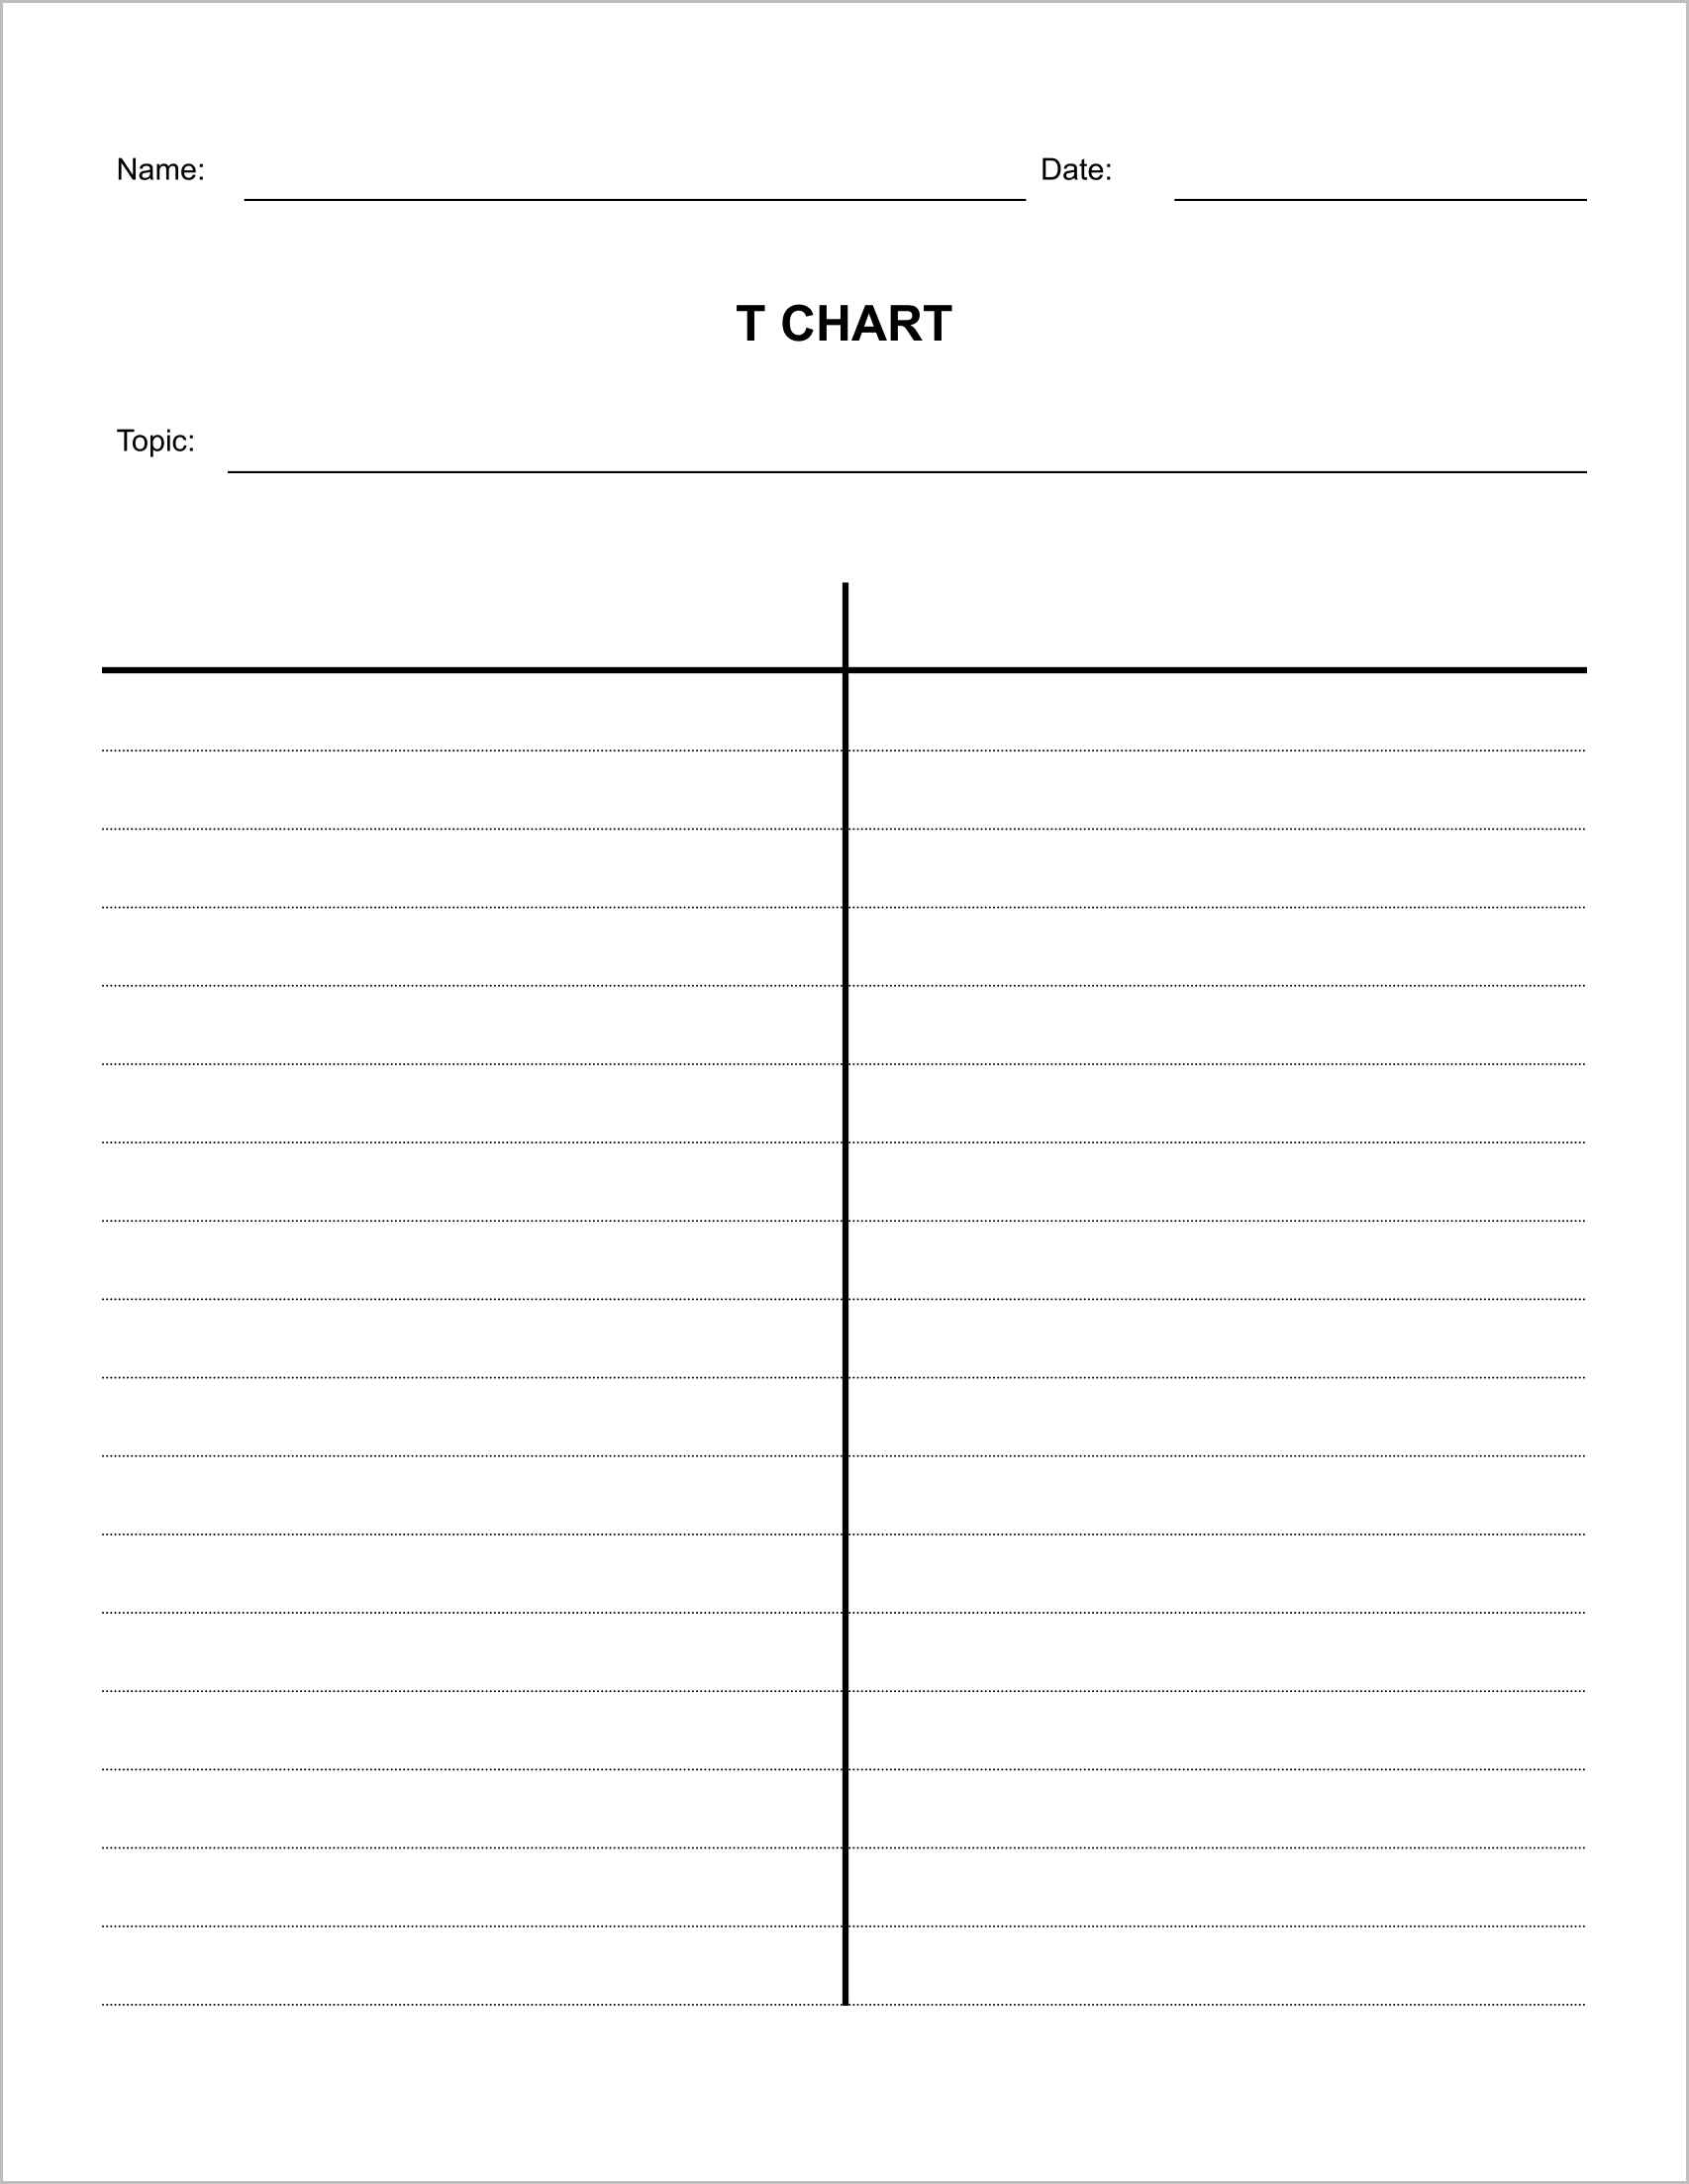
Are you wondering how to make a chart in Google Docs?
Don’t worry, making T charts in Google Docs is a breeze, and in this guide, you’ll learn the exact steps to create one.
Along with that, I will share four T-chart templates that you can use for free.
Let’s get started!
You’ll also like:
How to Put a Bar Over a Letter in Google Docs
How to Do a Subscript in Google Docs
How to Insert a Hat Symbol in Google Docs
To make a T chart in Google Docs:
Step 1: Go to Insert > Table 2 x 6.
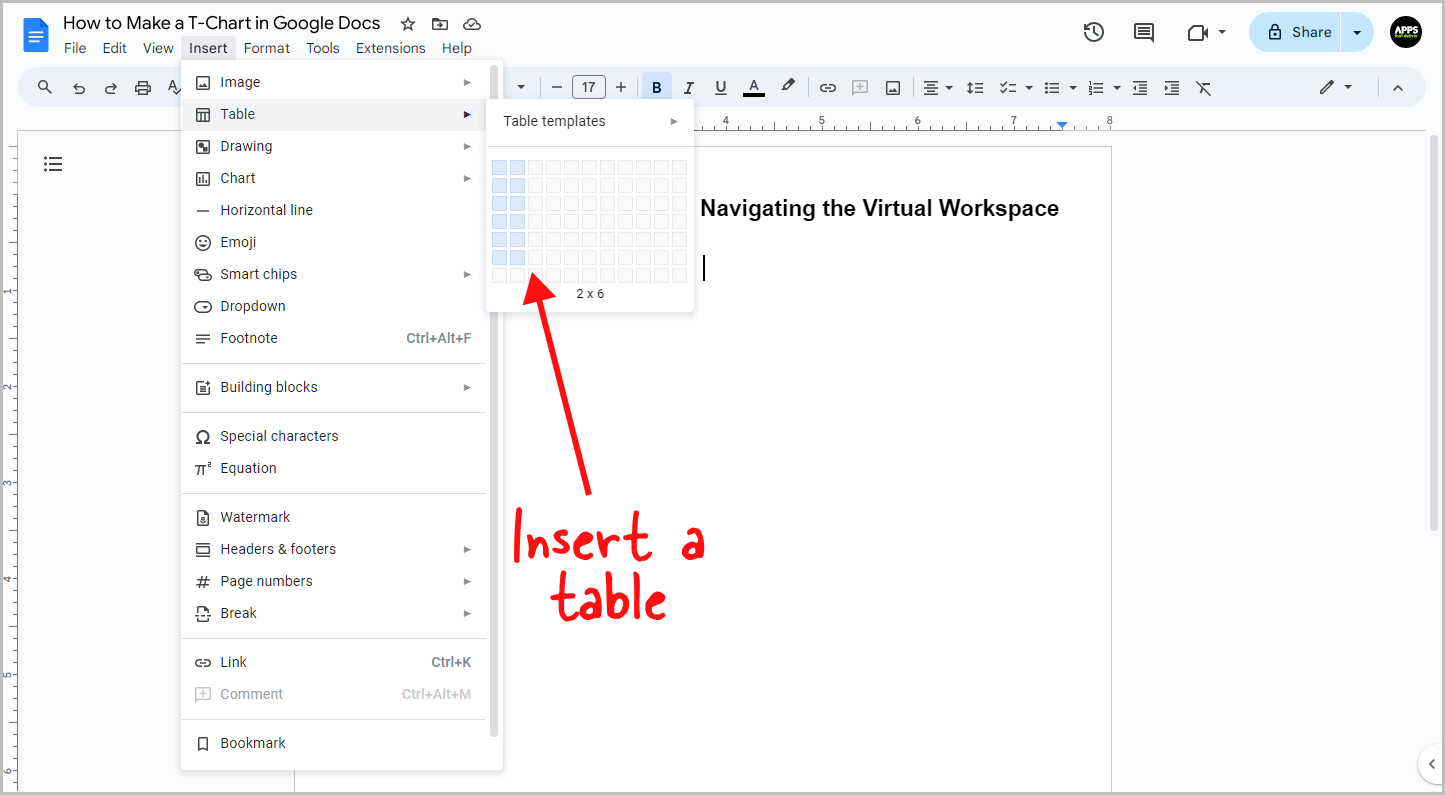
A T chart is basically a table where you enter the headings and the points.
I’ll be creating a table with two columns and six rows since I have five points in each column, and the first row will be used for headings.
So to begin, you need to first enter a 2 x 6 table.
To do so, go to the “Insert” option, select “Table” from the list of options, and then choose a 2 x 6 table.
Step 2: In the first row, enter the headings.
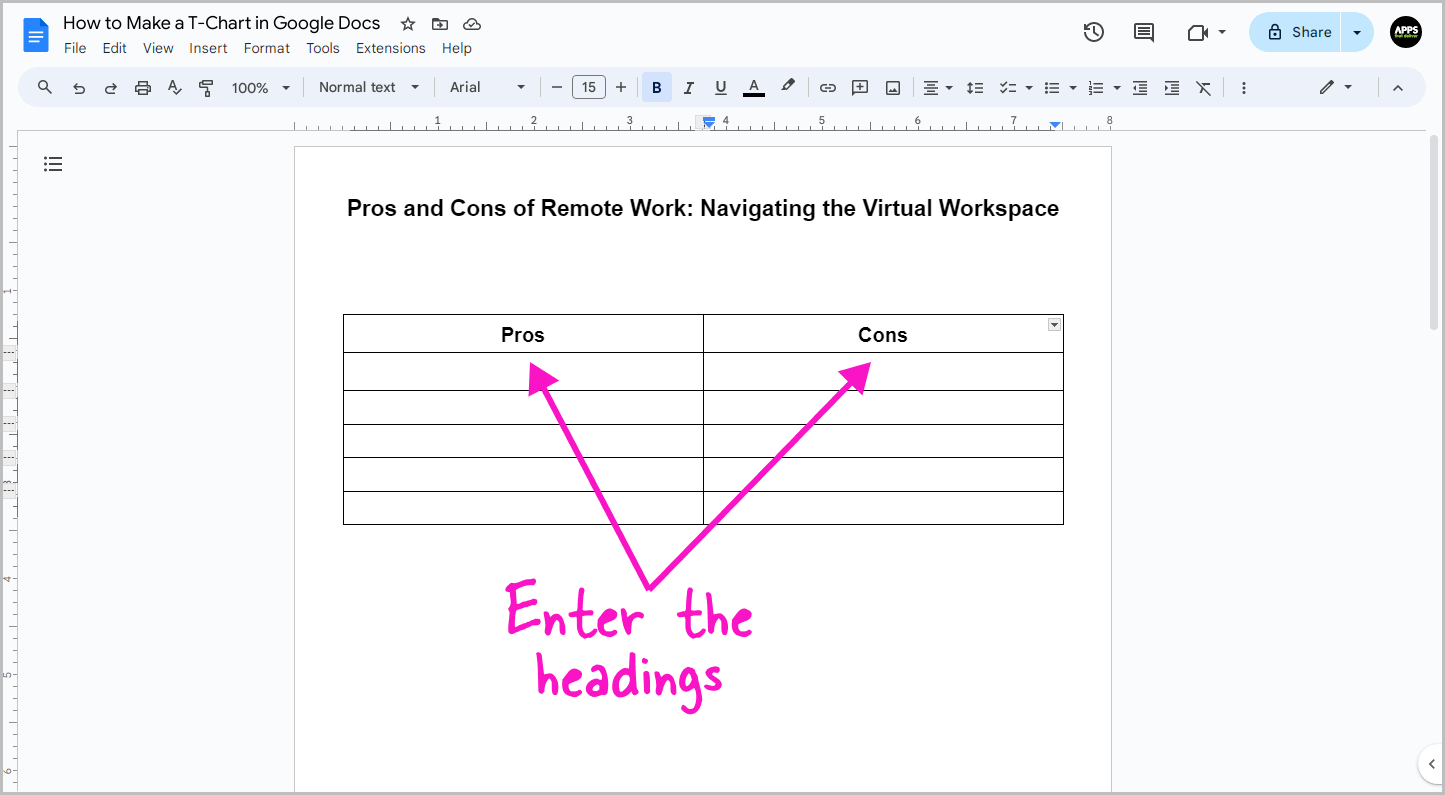
After creating the table, start by entering the headings.
Click inside the first cell of the first column and then type the heading name; similarly, type the second heading name in the first cell of the second column.
For example, I have shown the pros and cons of remote work in my chart, so my first heading is “Pros” and my second heading is “Cons.”
Step 3: Enter the points.
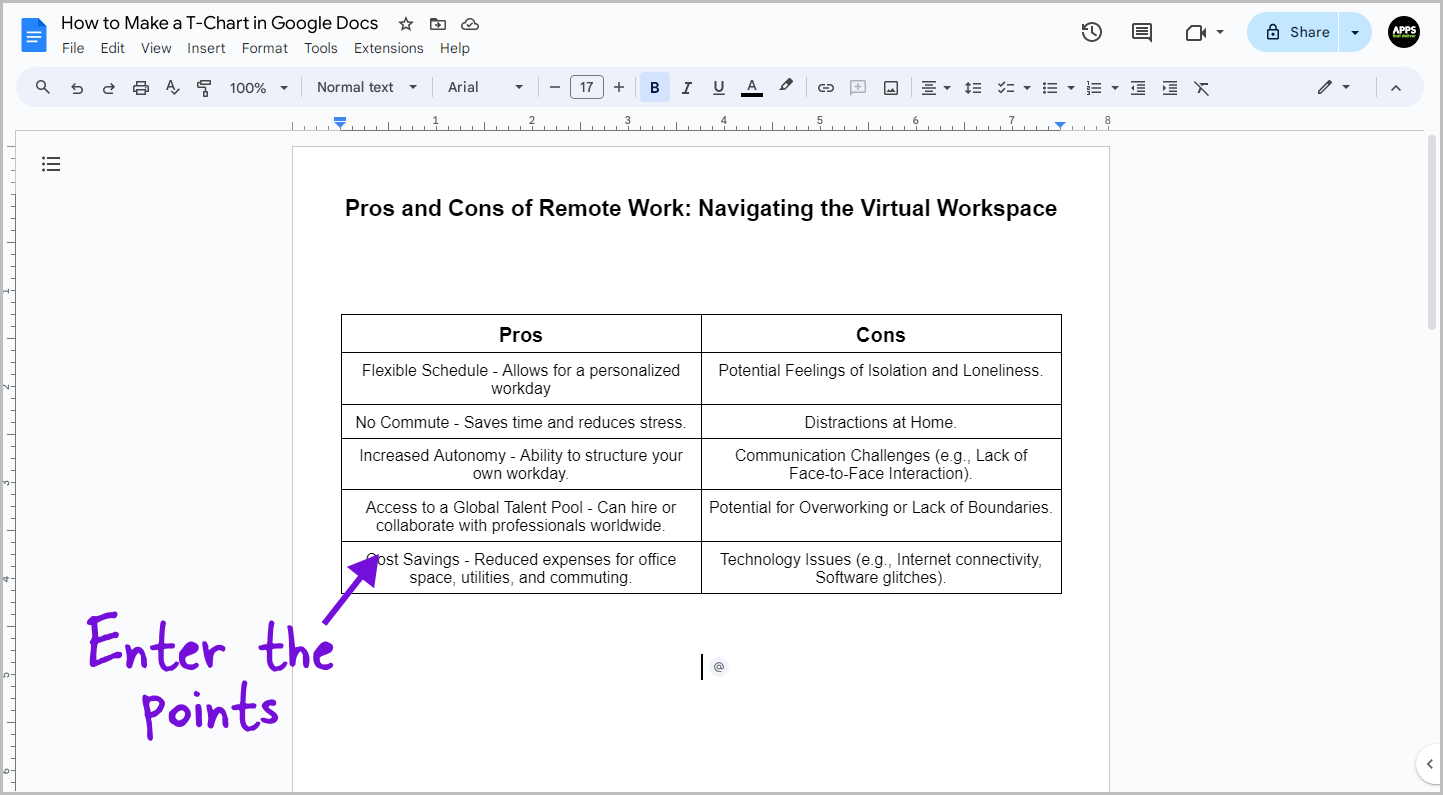
Now, start entering the points in the columns. You can also use bulleted or a numbered list to make the points look more presentable.
Step 4: Select all the outer borders of the table.
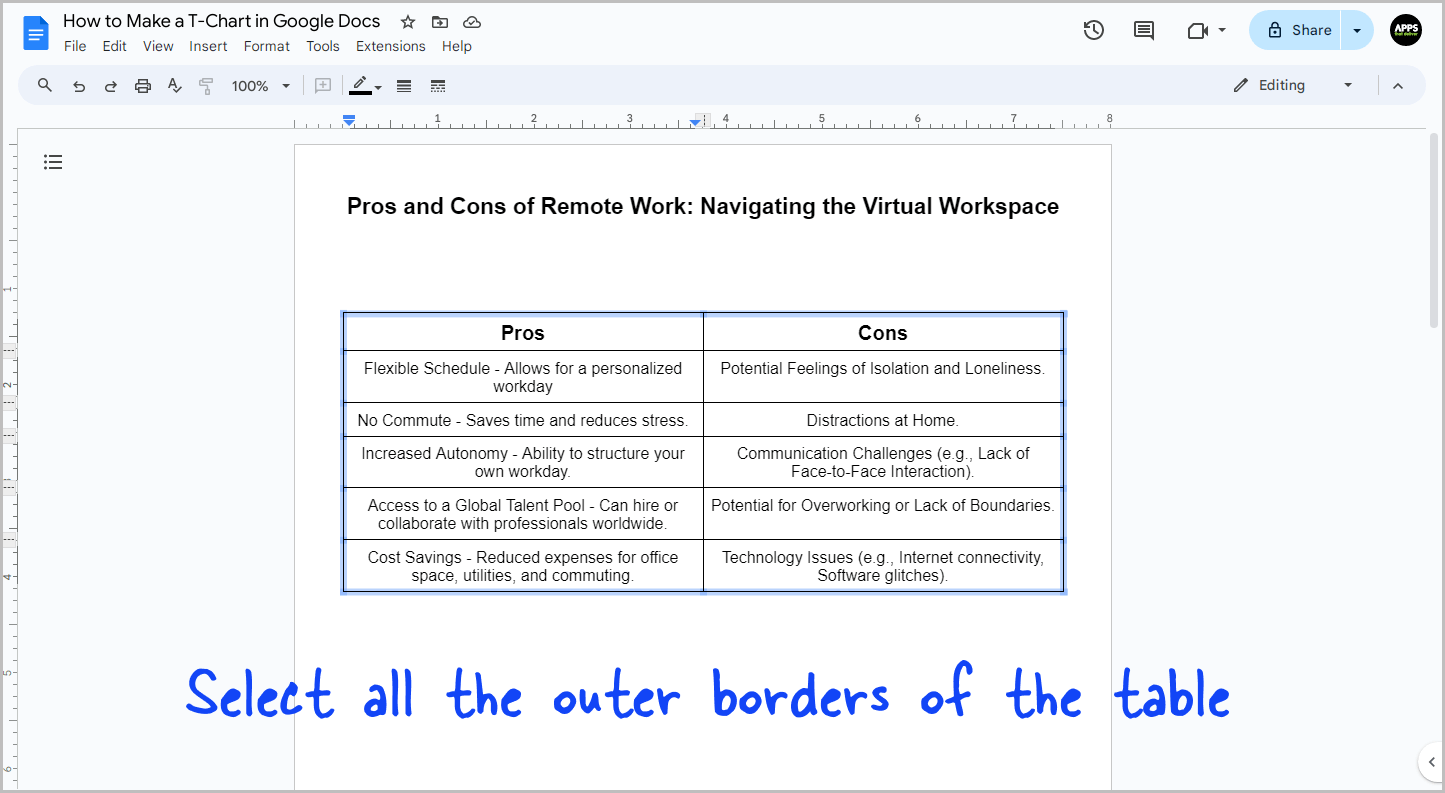
It is now time to remove all the outer borders so that the table looks like a big T.
To begin, press and hold the “Shift” key and then select all the outer borders of the table, as shown in the screenshot above.
Step 5: Set the “Table border width” to “0.”
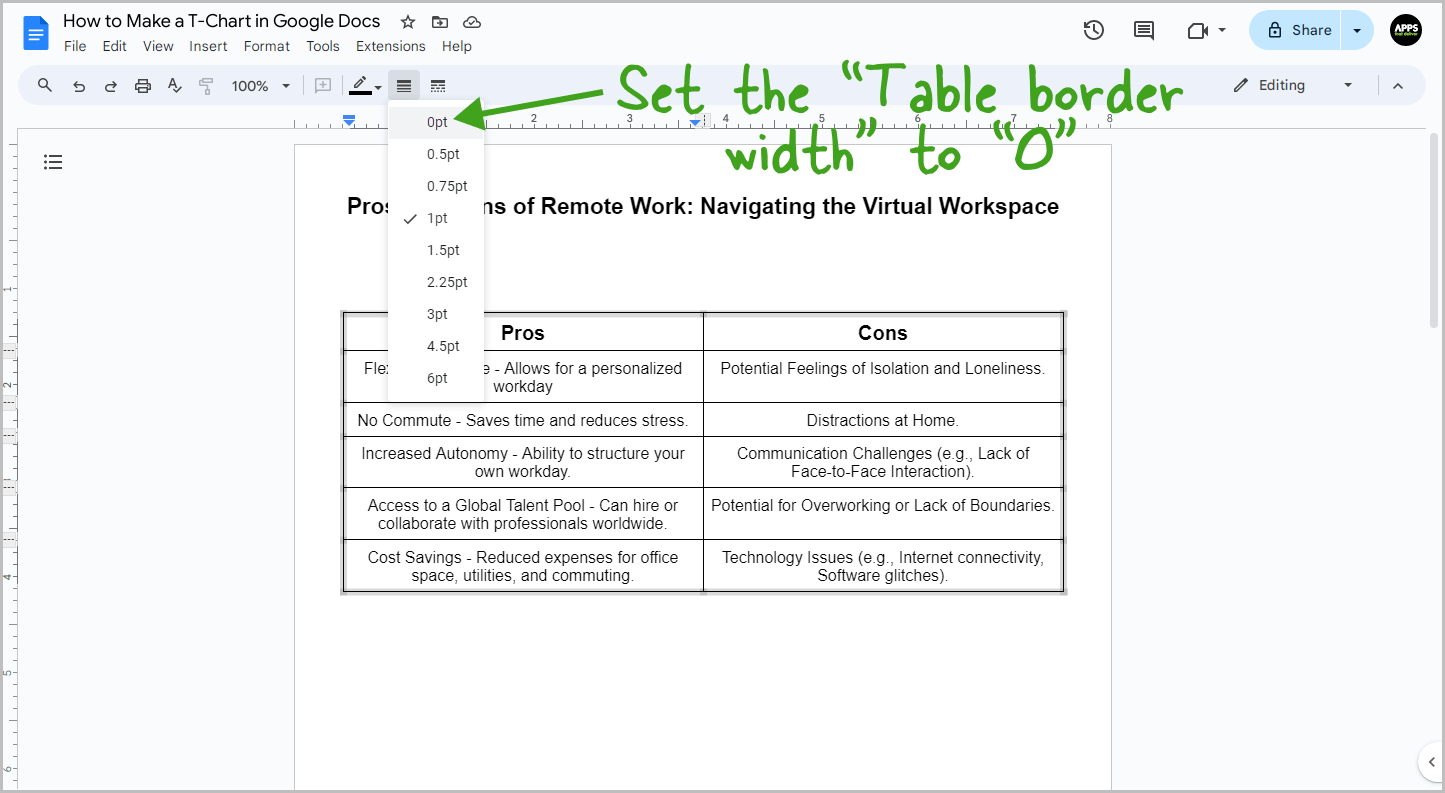
After selecting all the borders, click on the “Border width” option from the toolbar and then select “0pt.”
This will remove all the outer borders.
Step 6: Thicken Specific Borders
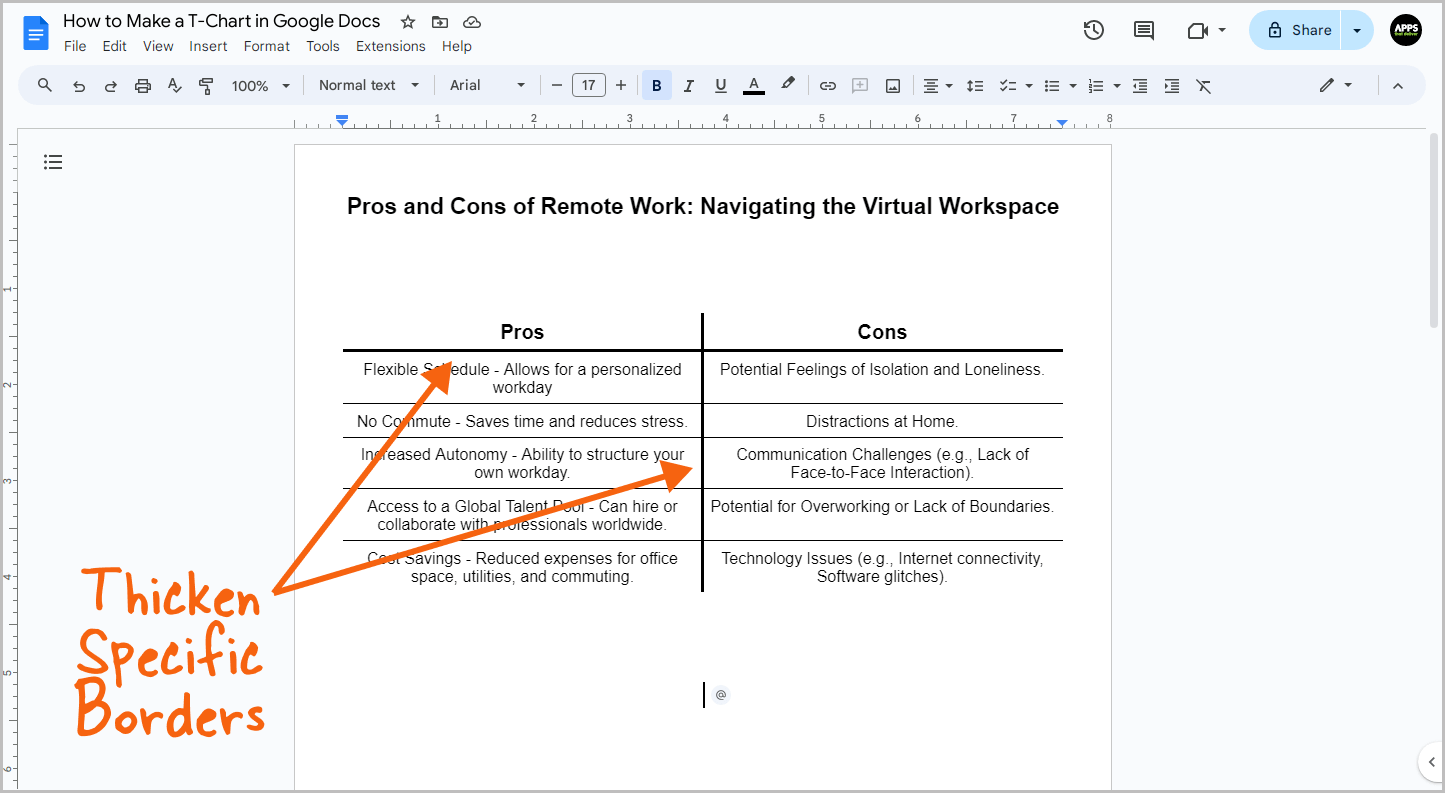
Similarly, select the main borders as shown in the screenshot above and set the “border width” to “2.25 pt.”.
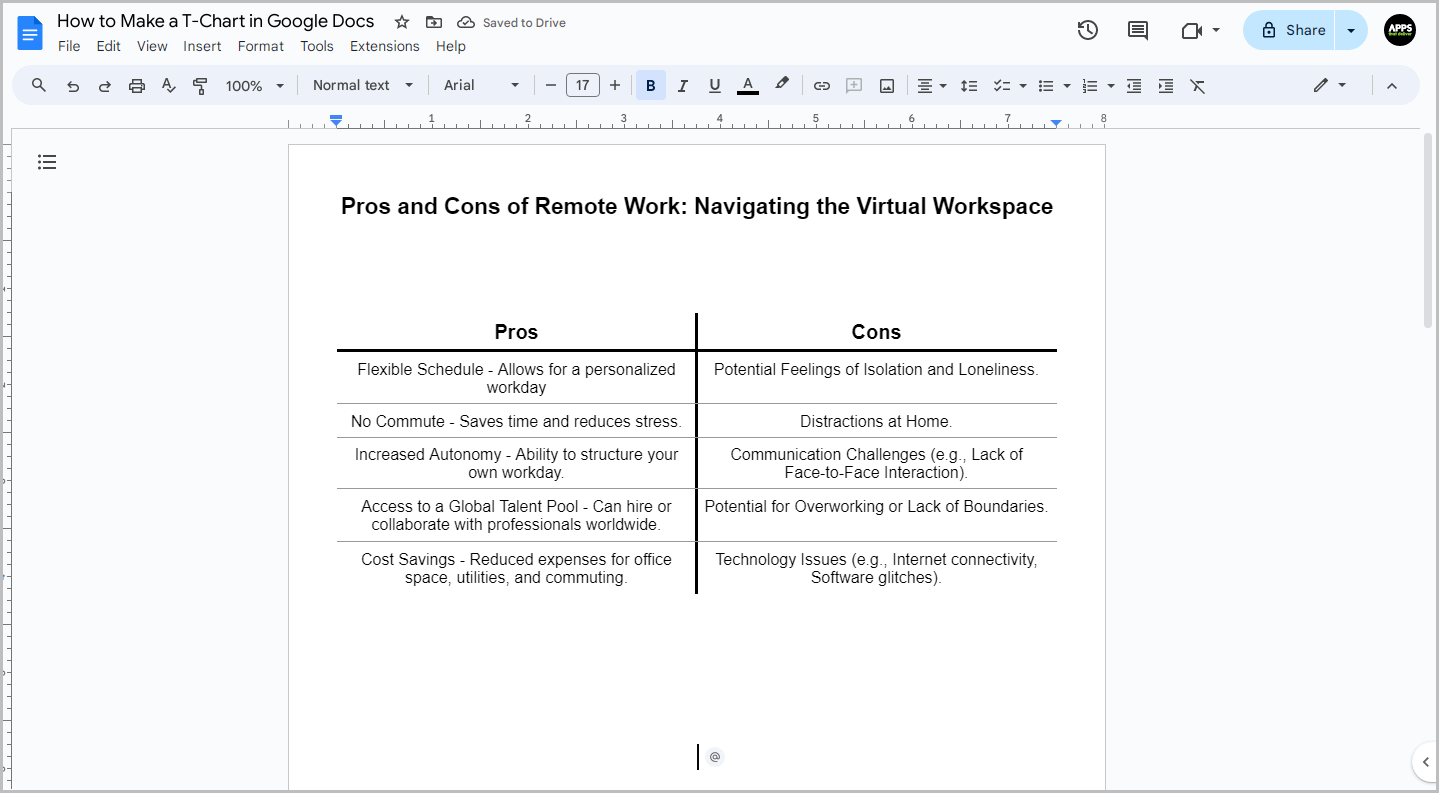
You can also make the lines inside the table a bit lighter, as shown in the screenshot below:
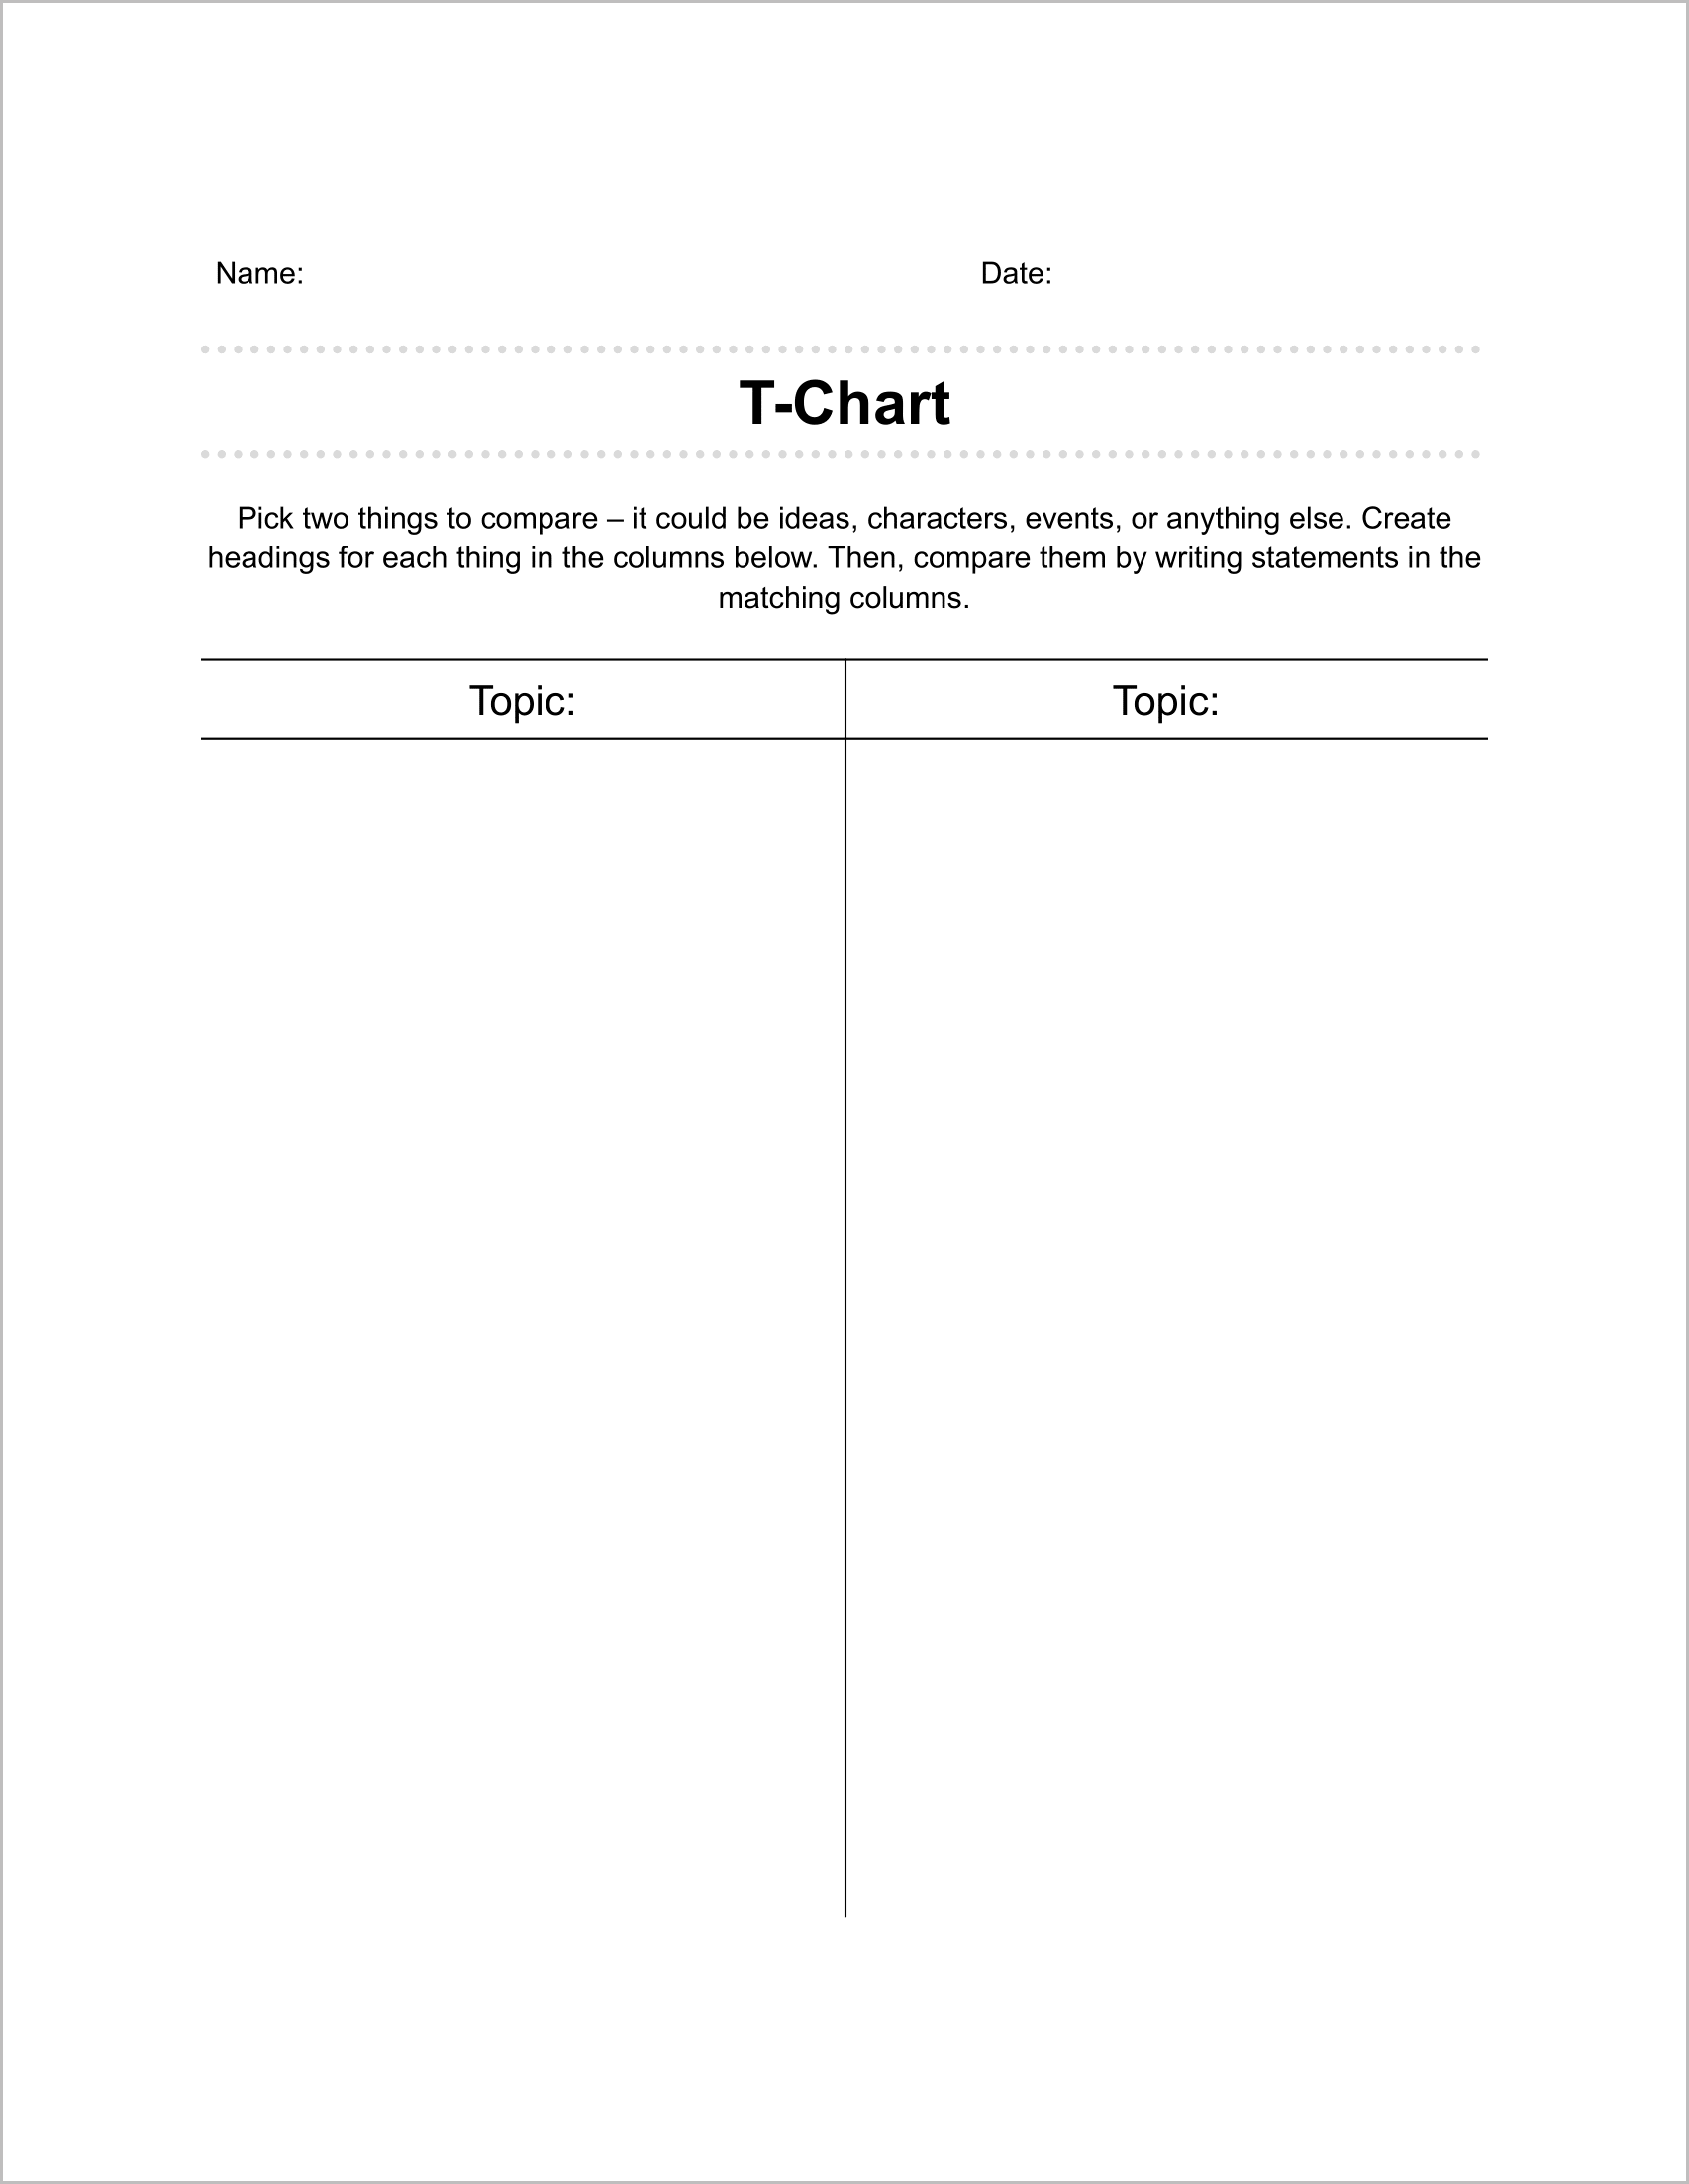
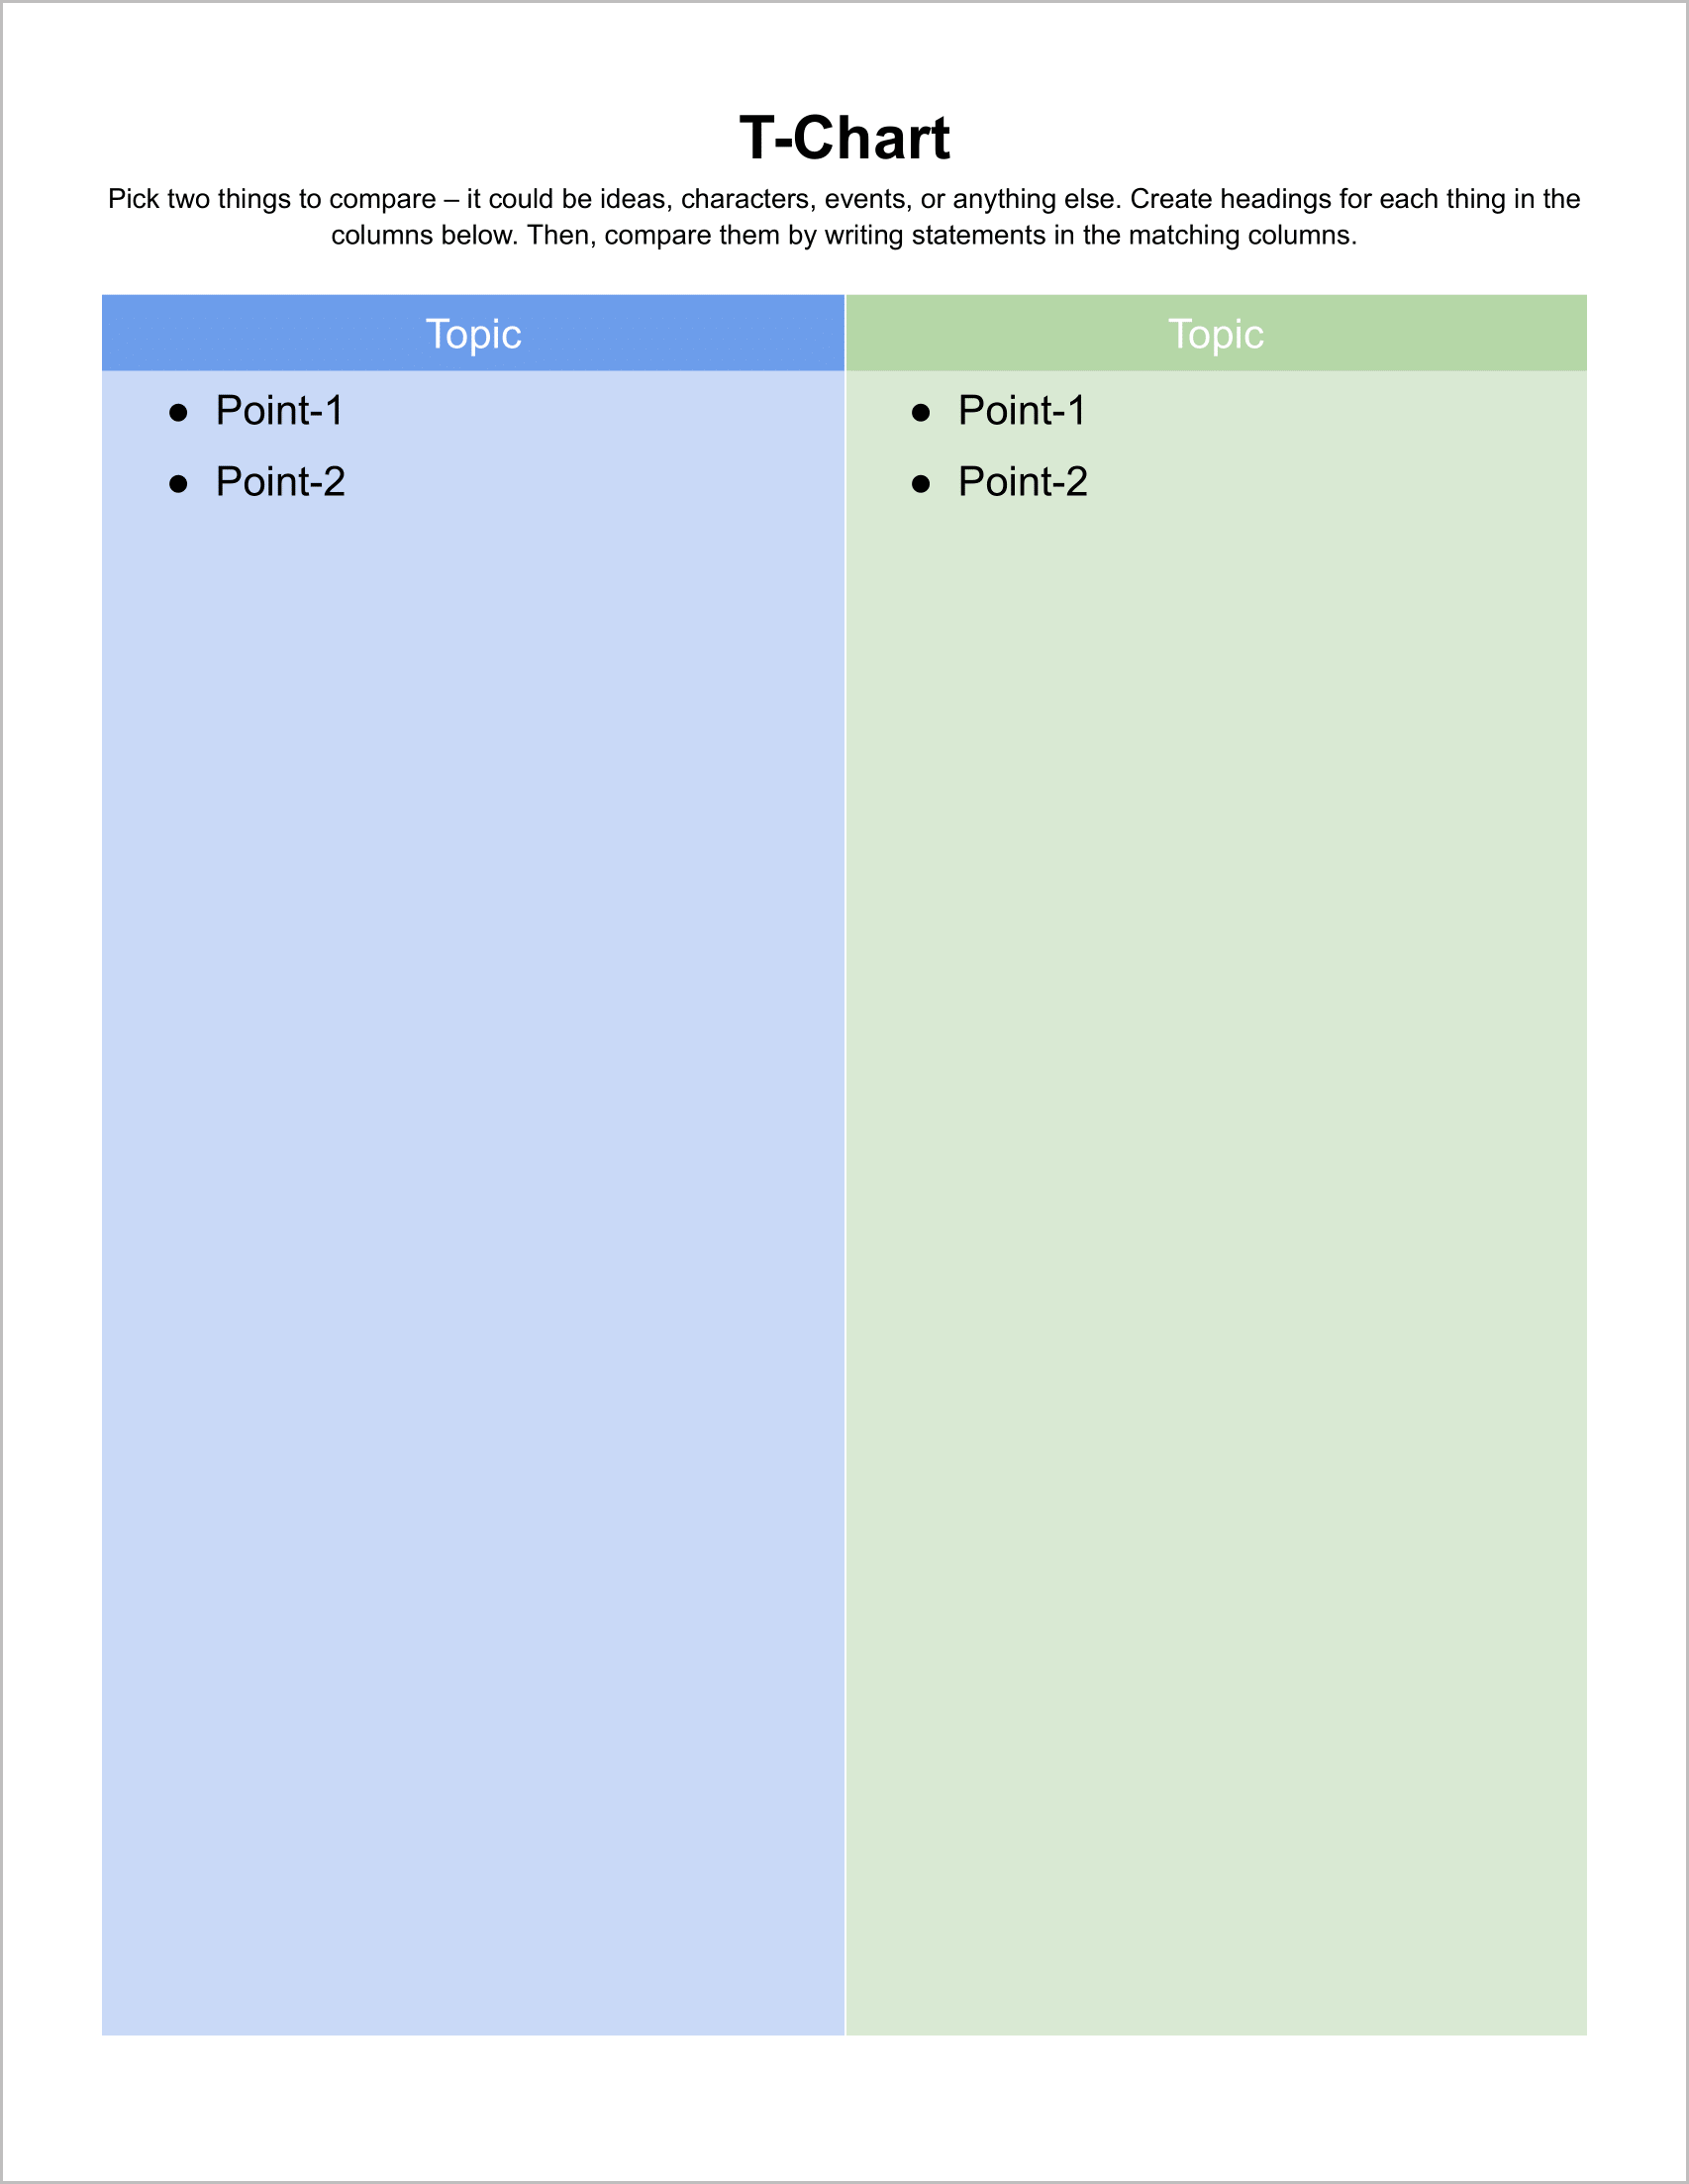
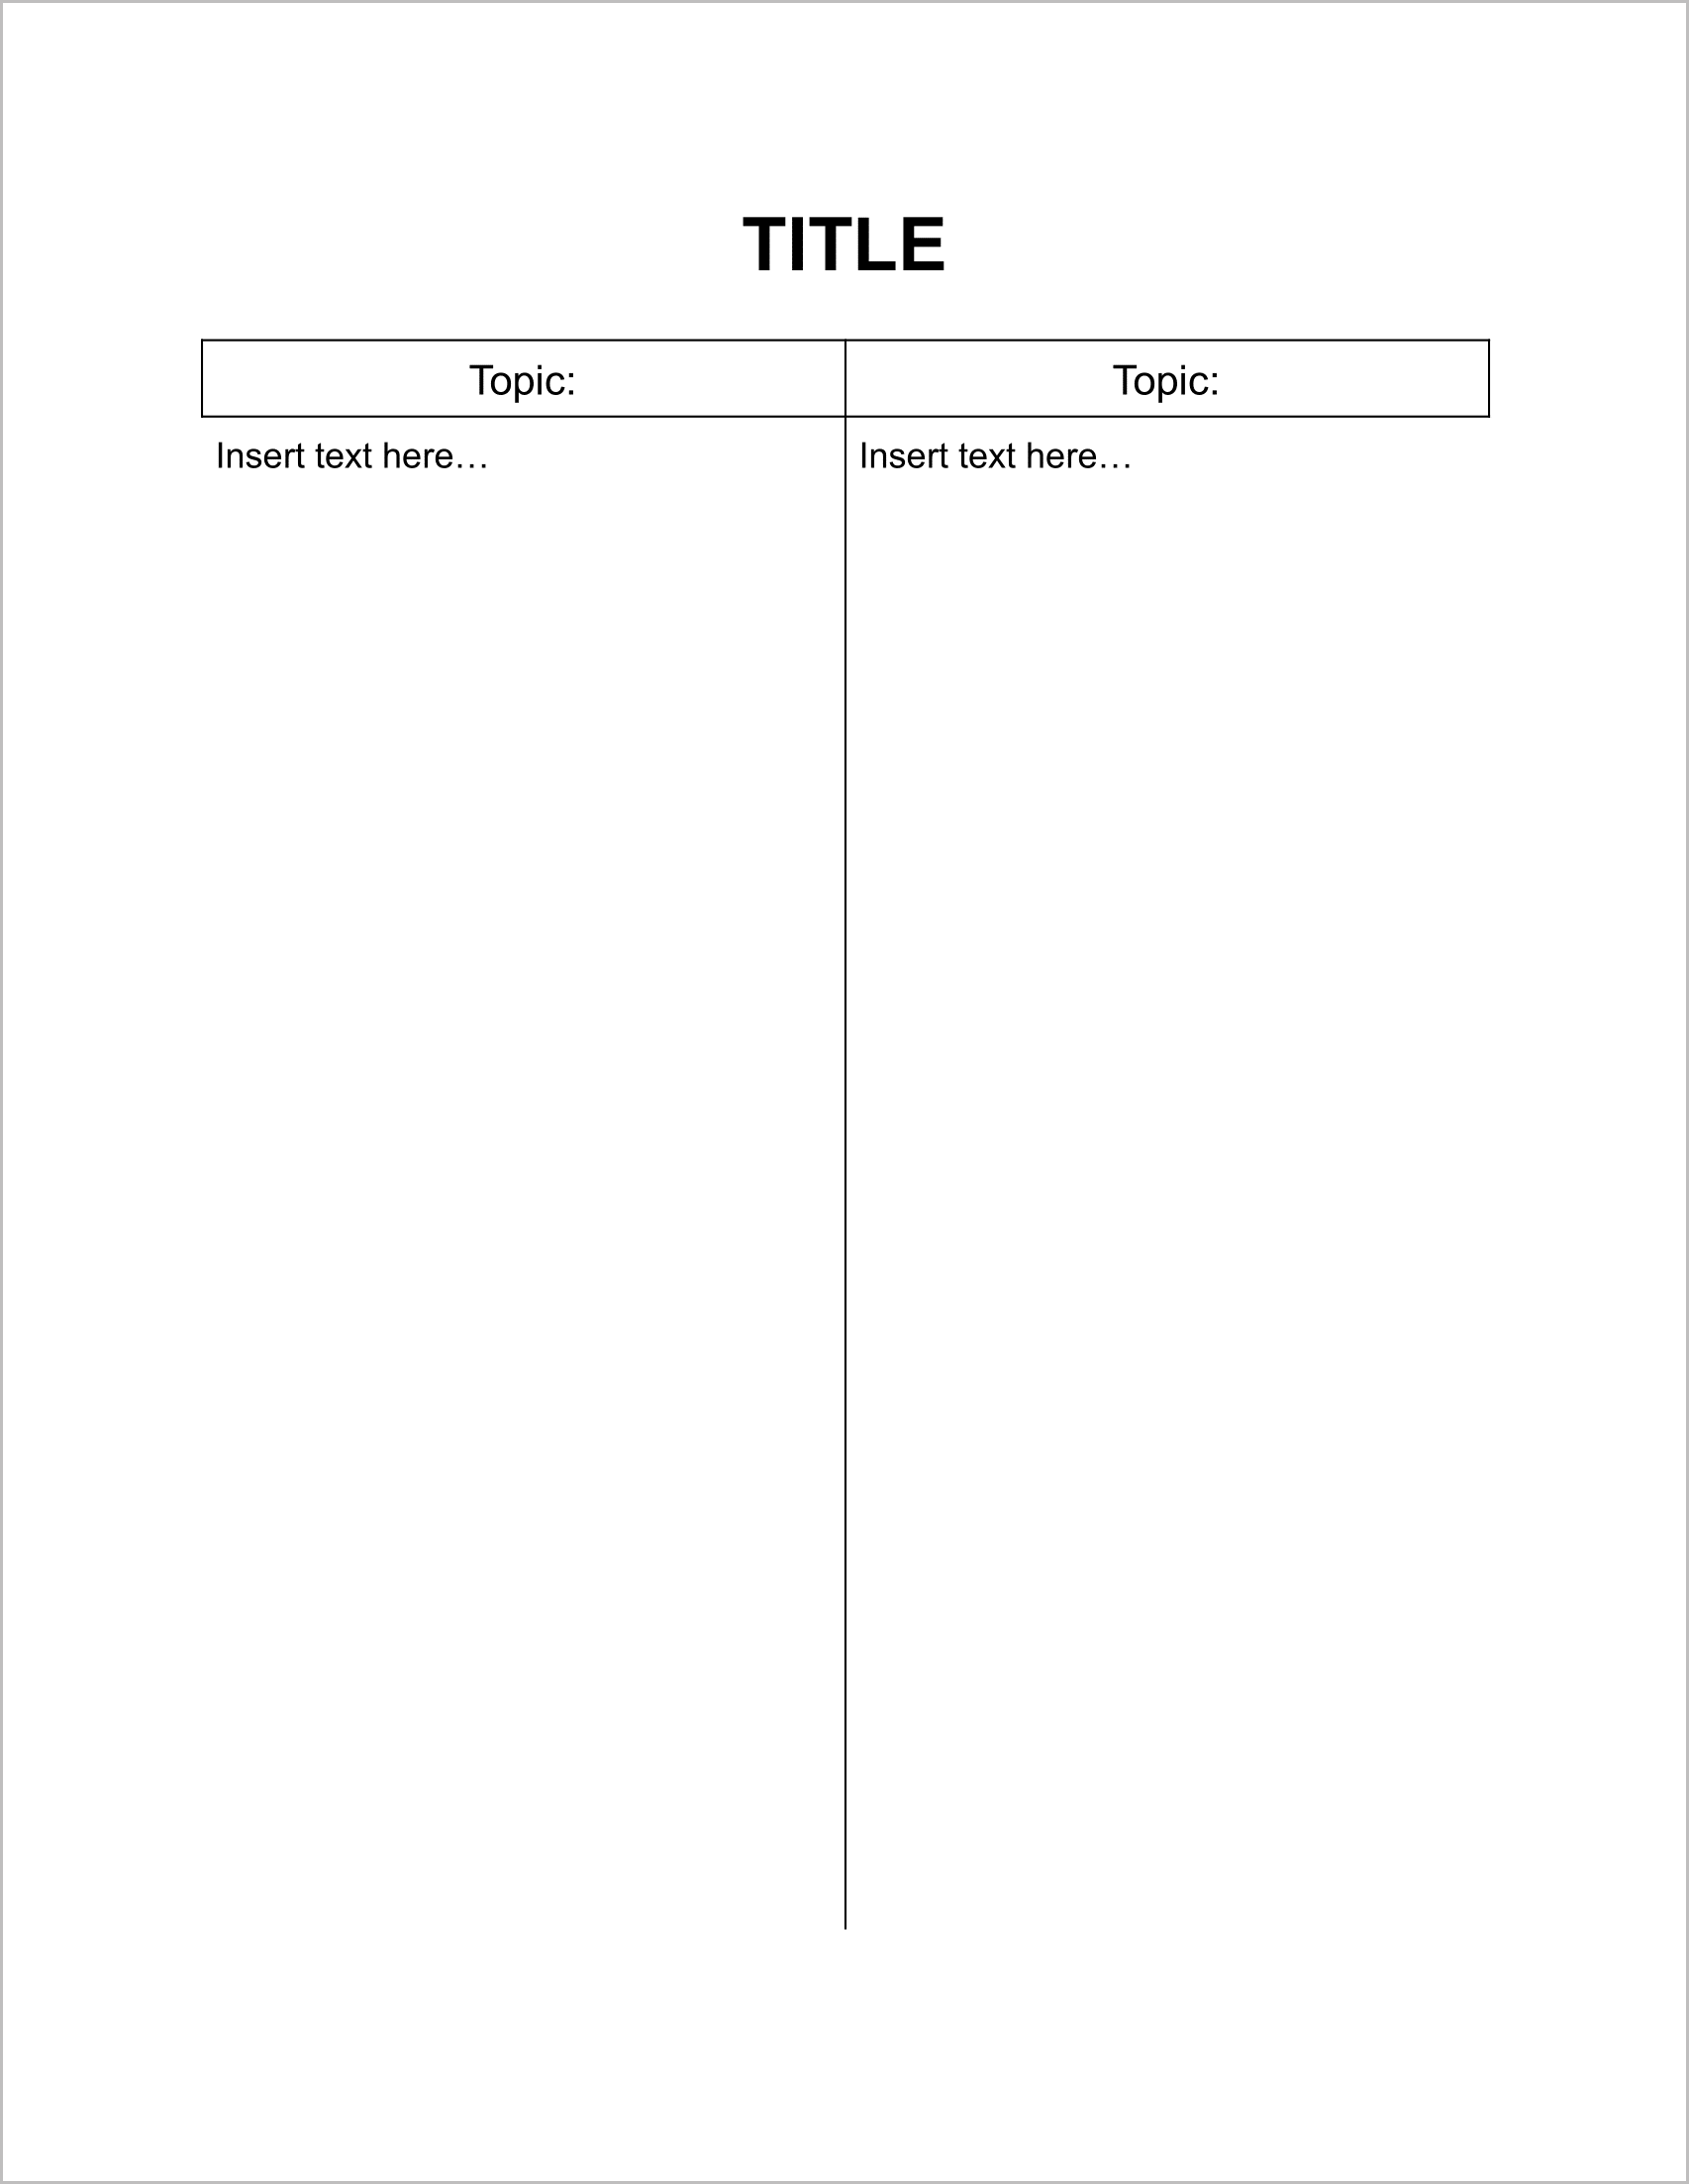
I have designed some T chart templates for you; simply select the one you like and then click on “Get this template” to use it.
Free T-Chart Templates for Google Docs
To use the templates:
- Click on the “Get this template” button.
- Preview the template.
- Make sure you are logged in to your Google account.
- Click on “USE TEMPLATE” to make a copy.
- Edit it as desired.
Template 1:
Template 2:
Template 3:
Template 4:
